NOTE: I am selling this product only through WhatsApp. If you are purchasing this from any other source like through Telegram group or Instagram or any other Website then thats not me, thats a Scammer. Please be aware.
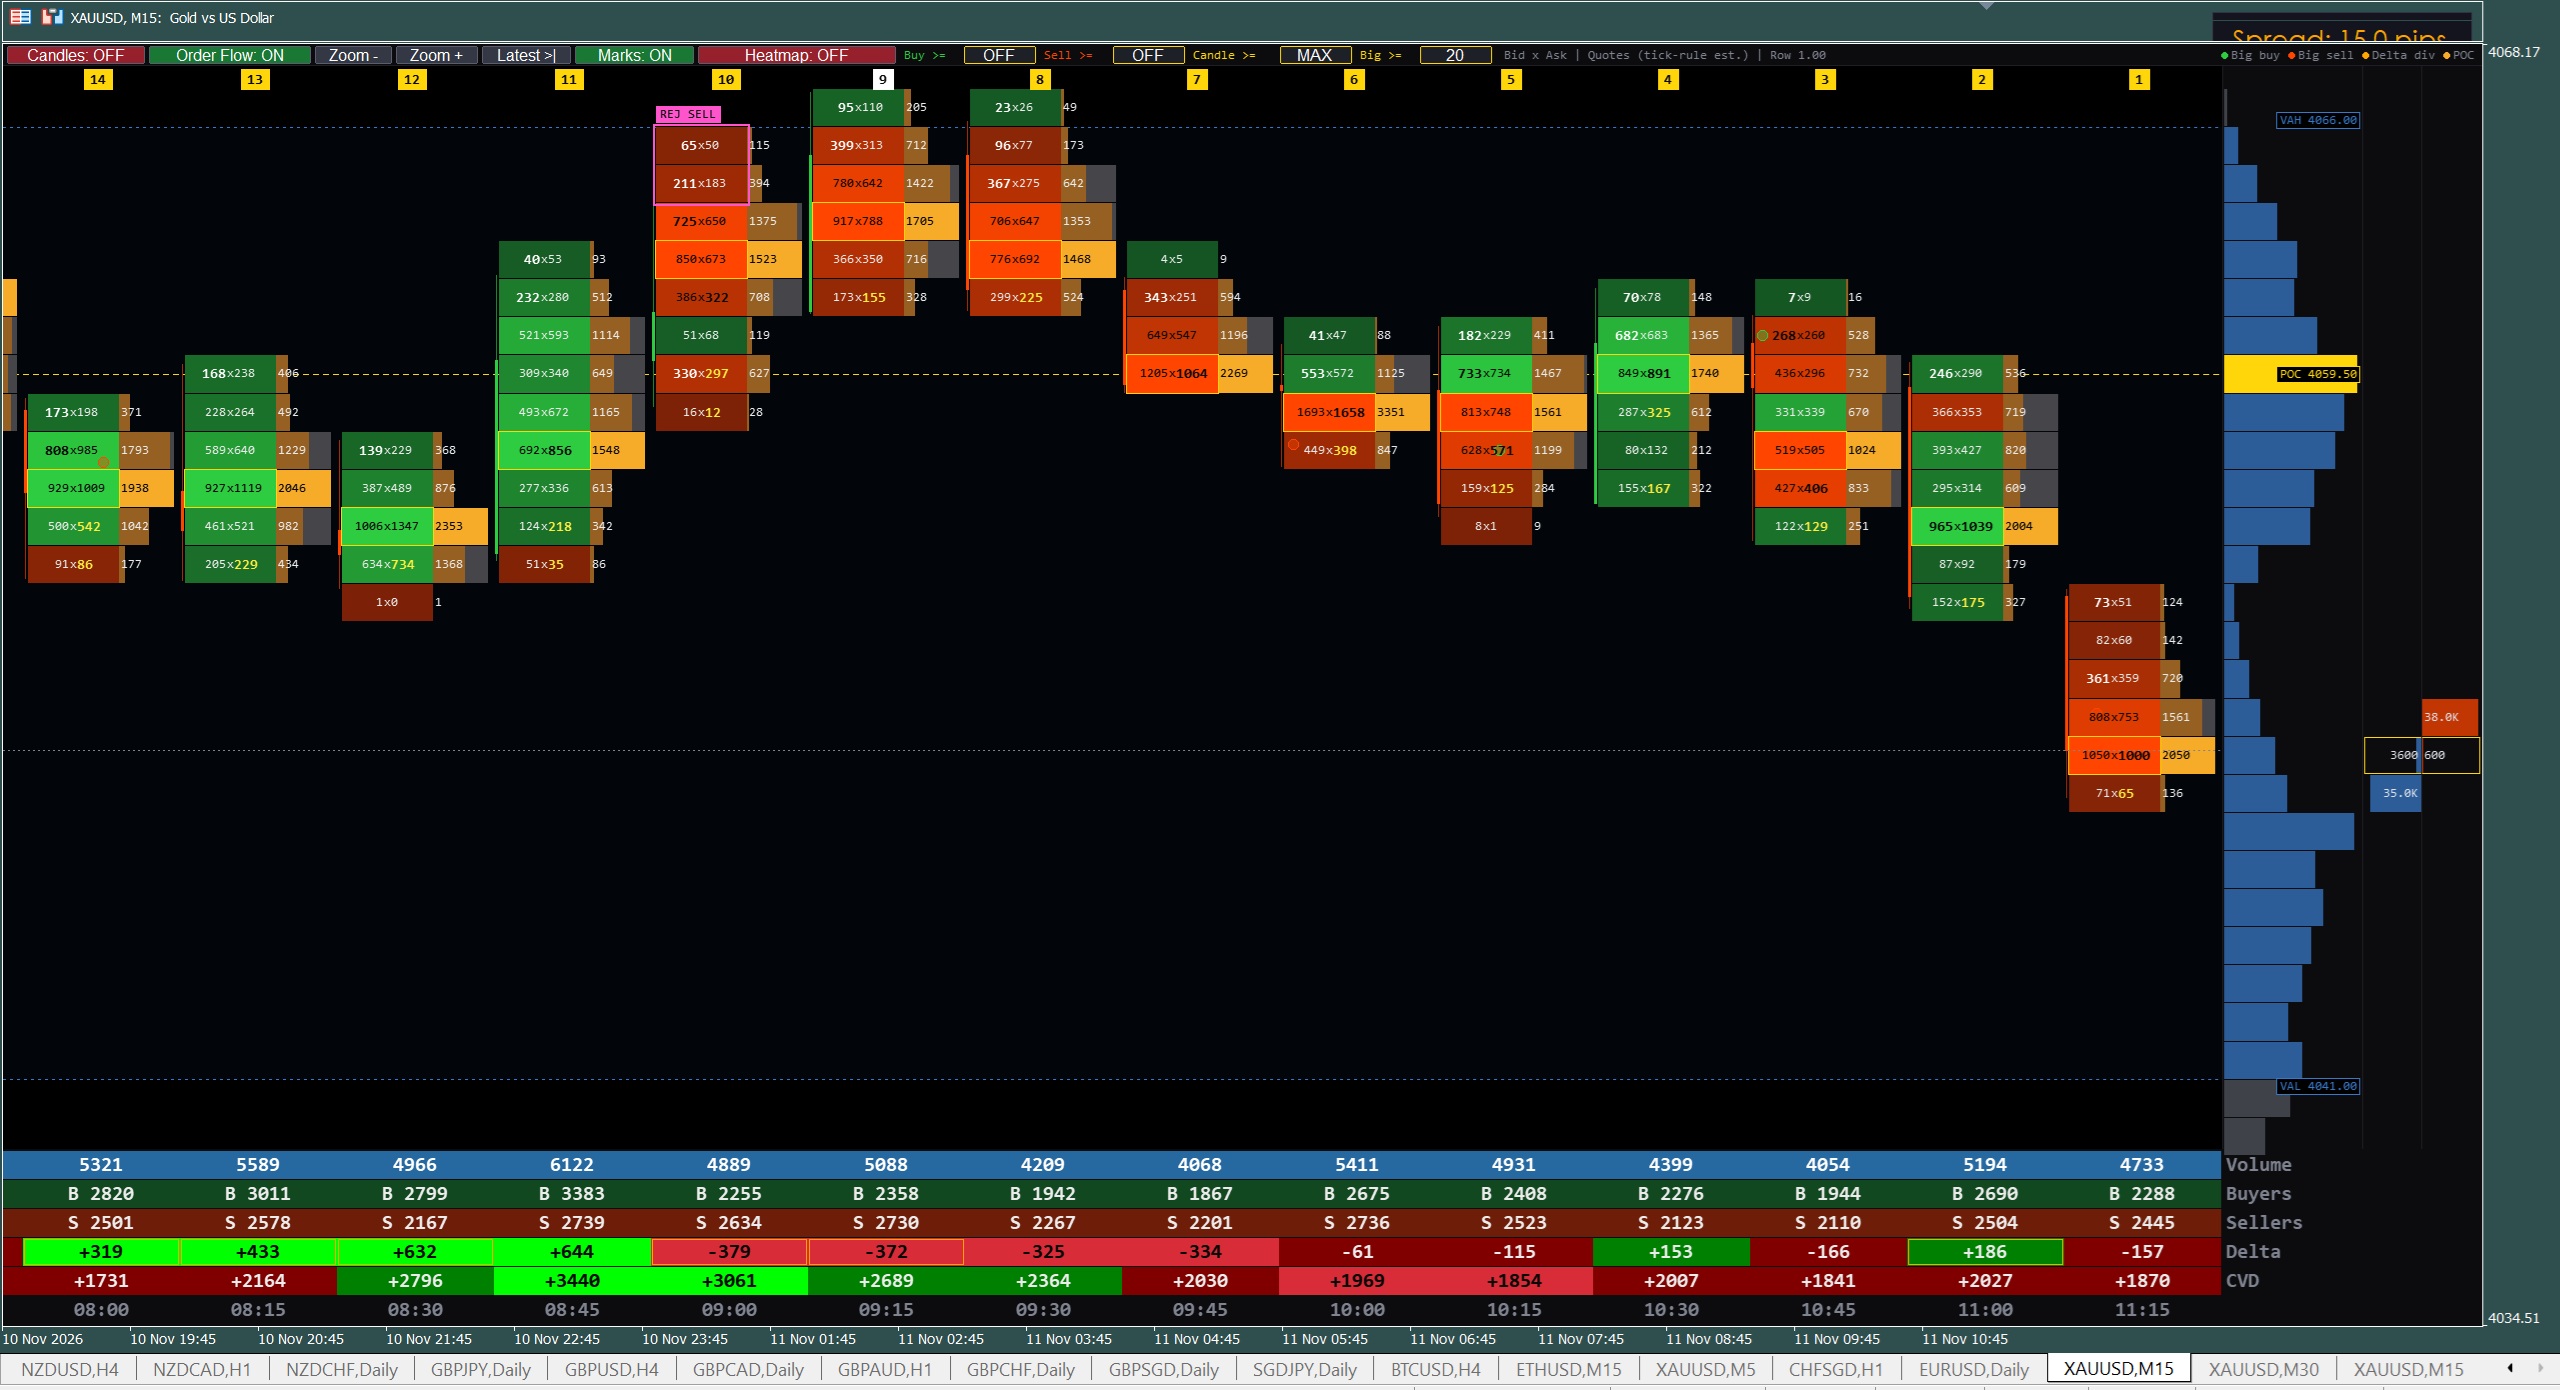
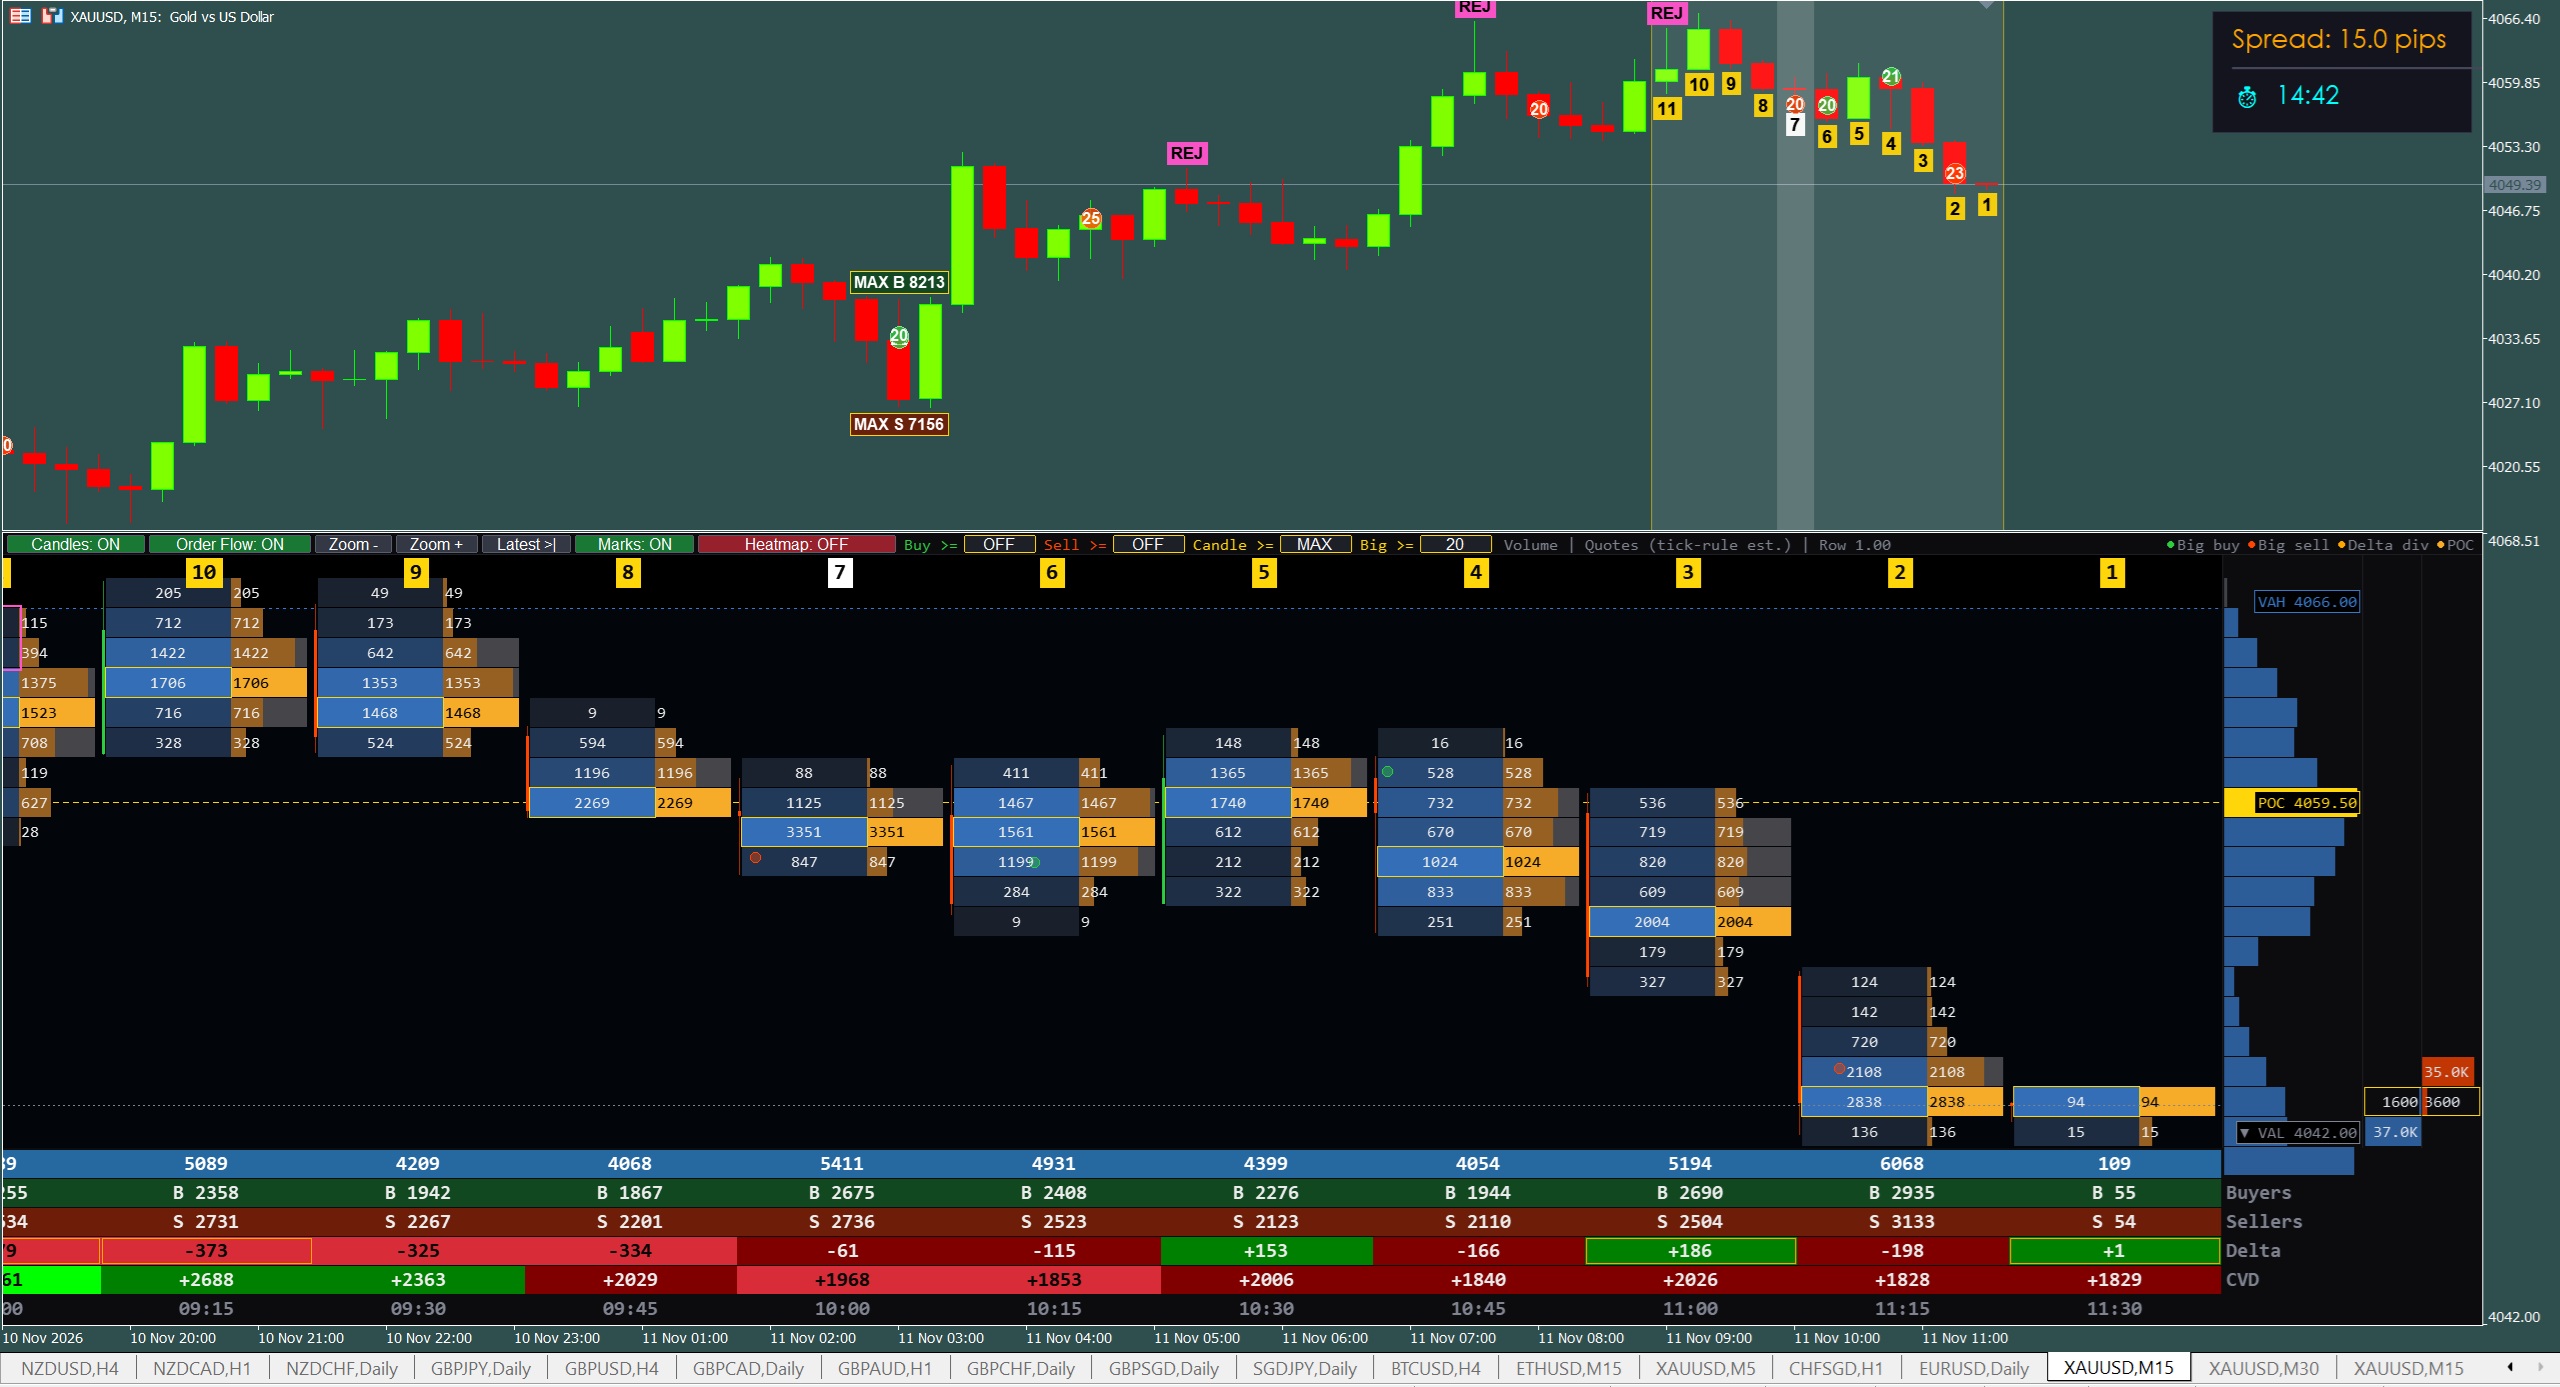
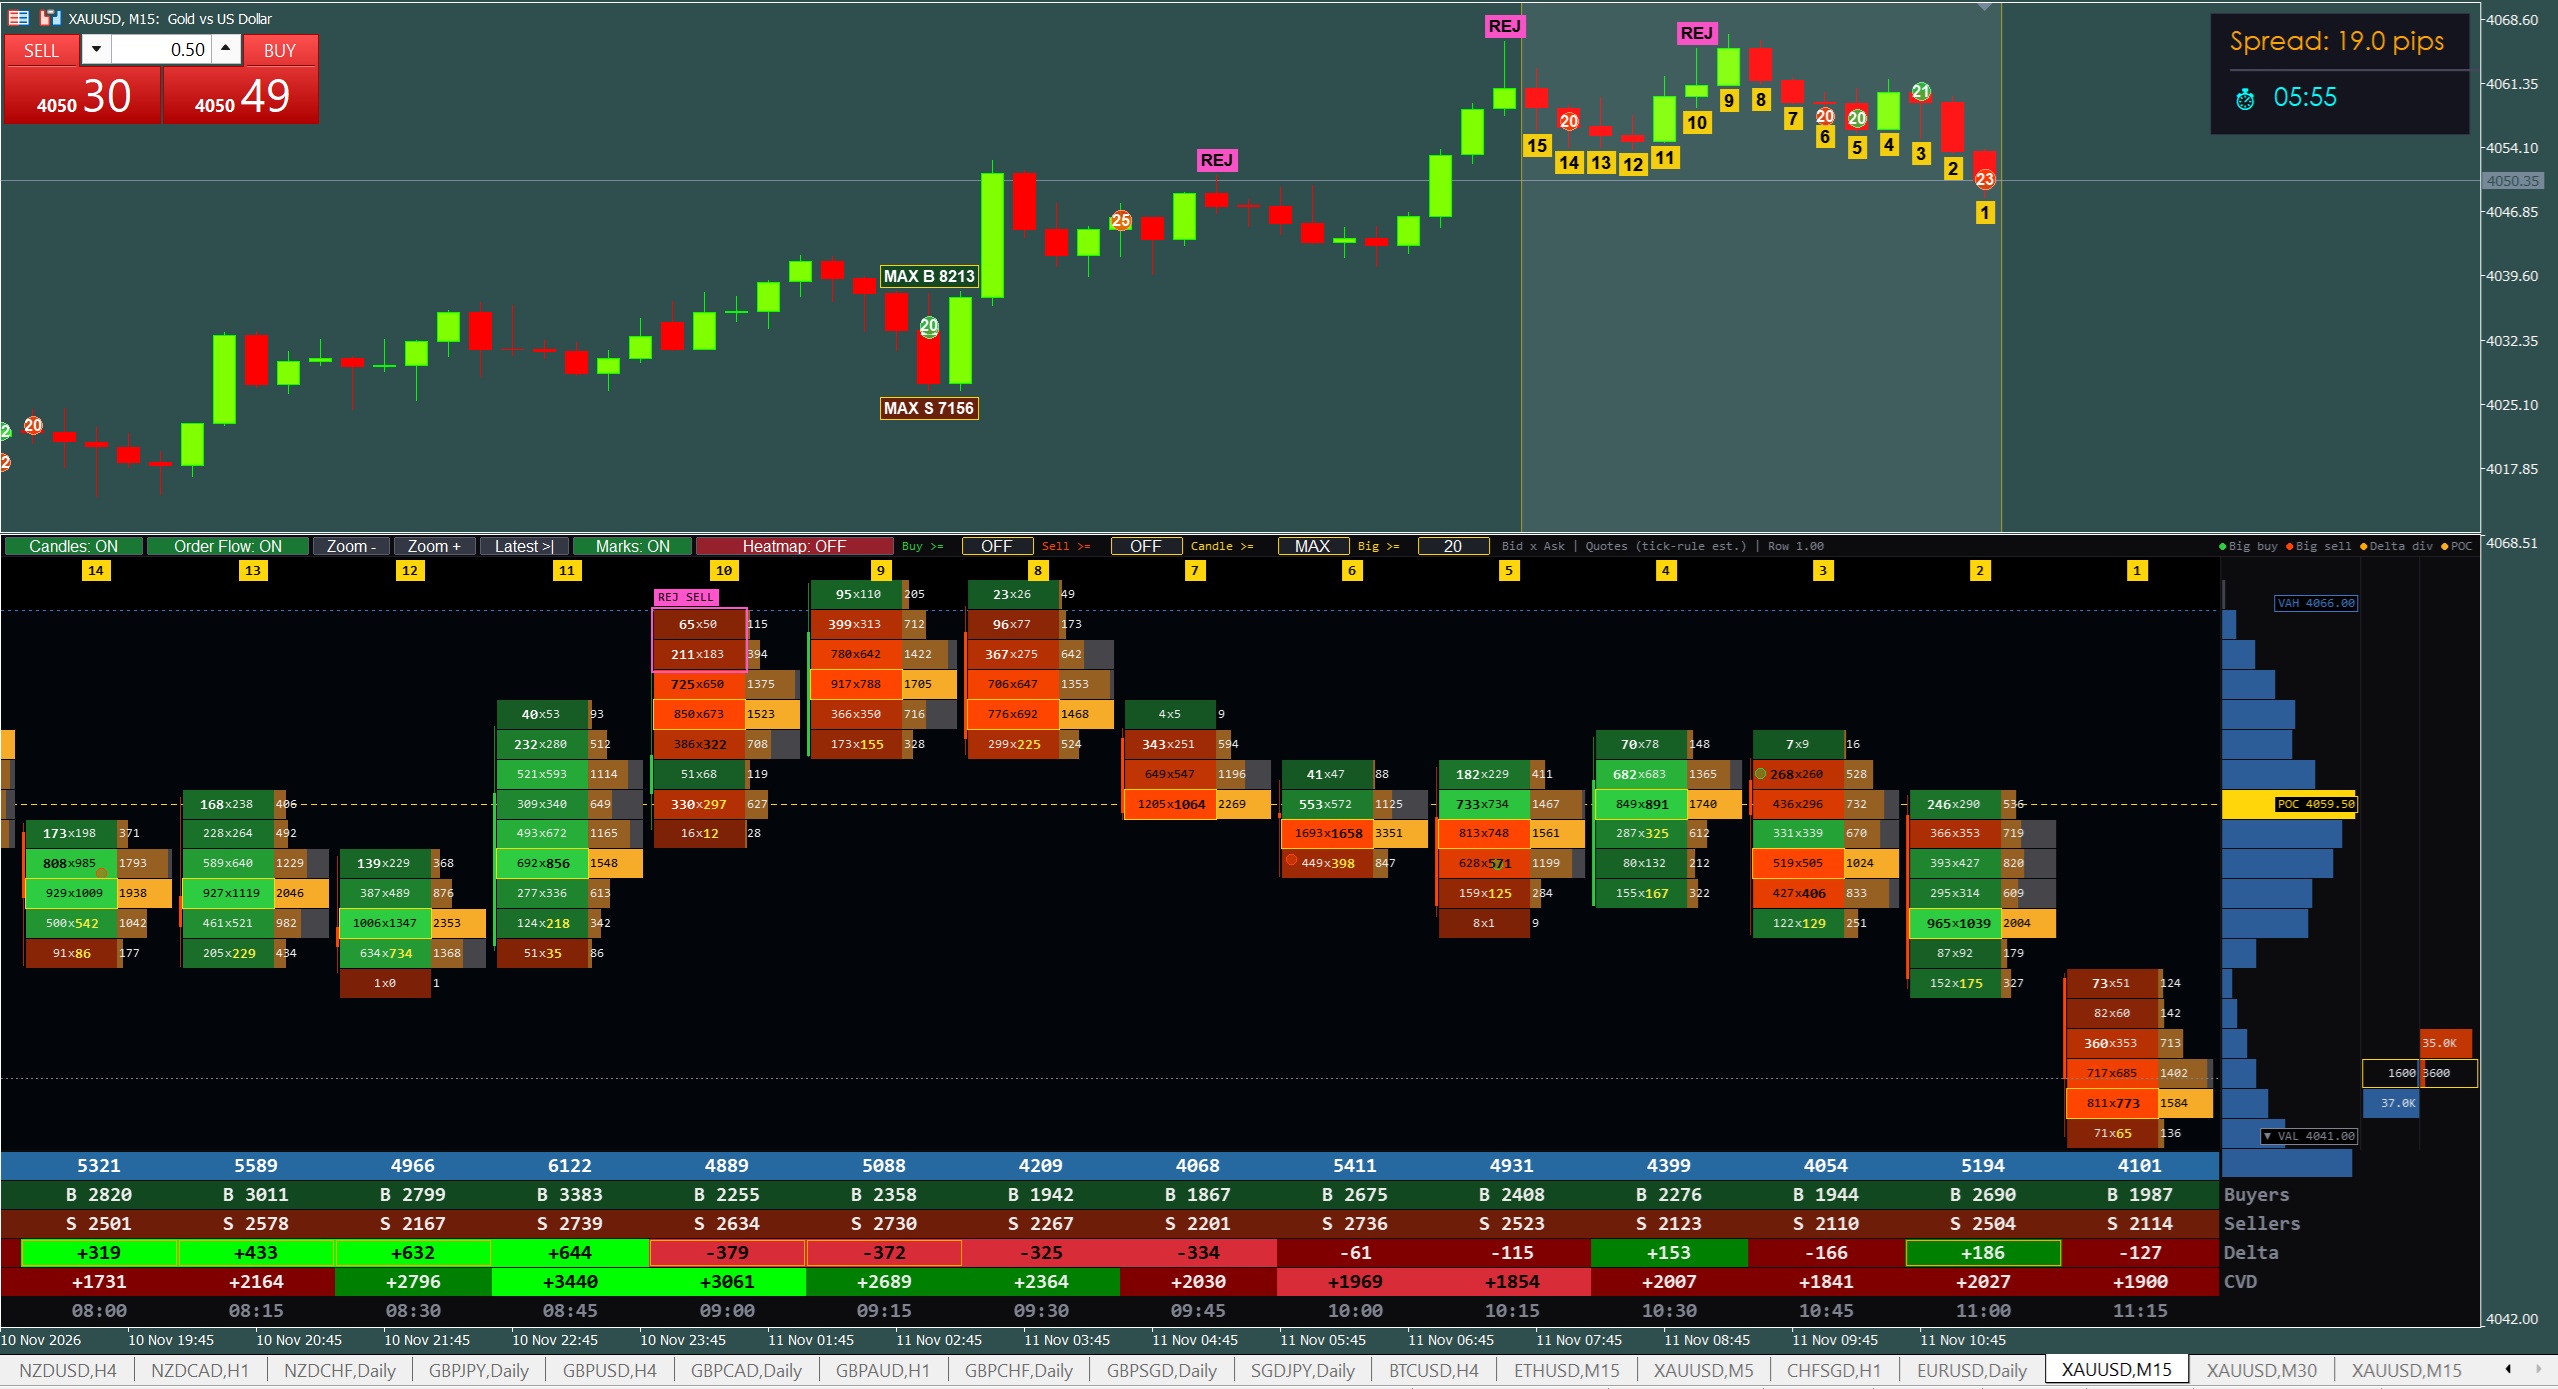
See who is really pushing the price inside every candle. The TrendingMoiz Order Flow Footprint Indicator brings an ATAS / MotiveWave-style footprint chart to MetaTrader 5 — Bid × Ask volume at every price level, Delta & CVD with strength colours, Diagonal & Stacked Imbalances, Absorption / Rejection signals, MAX Buyers & Sellers, Big Trades, Session Volume Profile (POC / VAH / VAL), plus a DOM ladder & Level-2 Heatmap — all in one clean window under your price chart. Works on every symbol and every time frame from M1 to Monthly. Shared screenshot is on the XAUUSD (Gold) M15 chart.
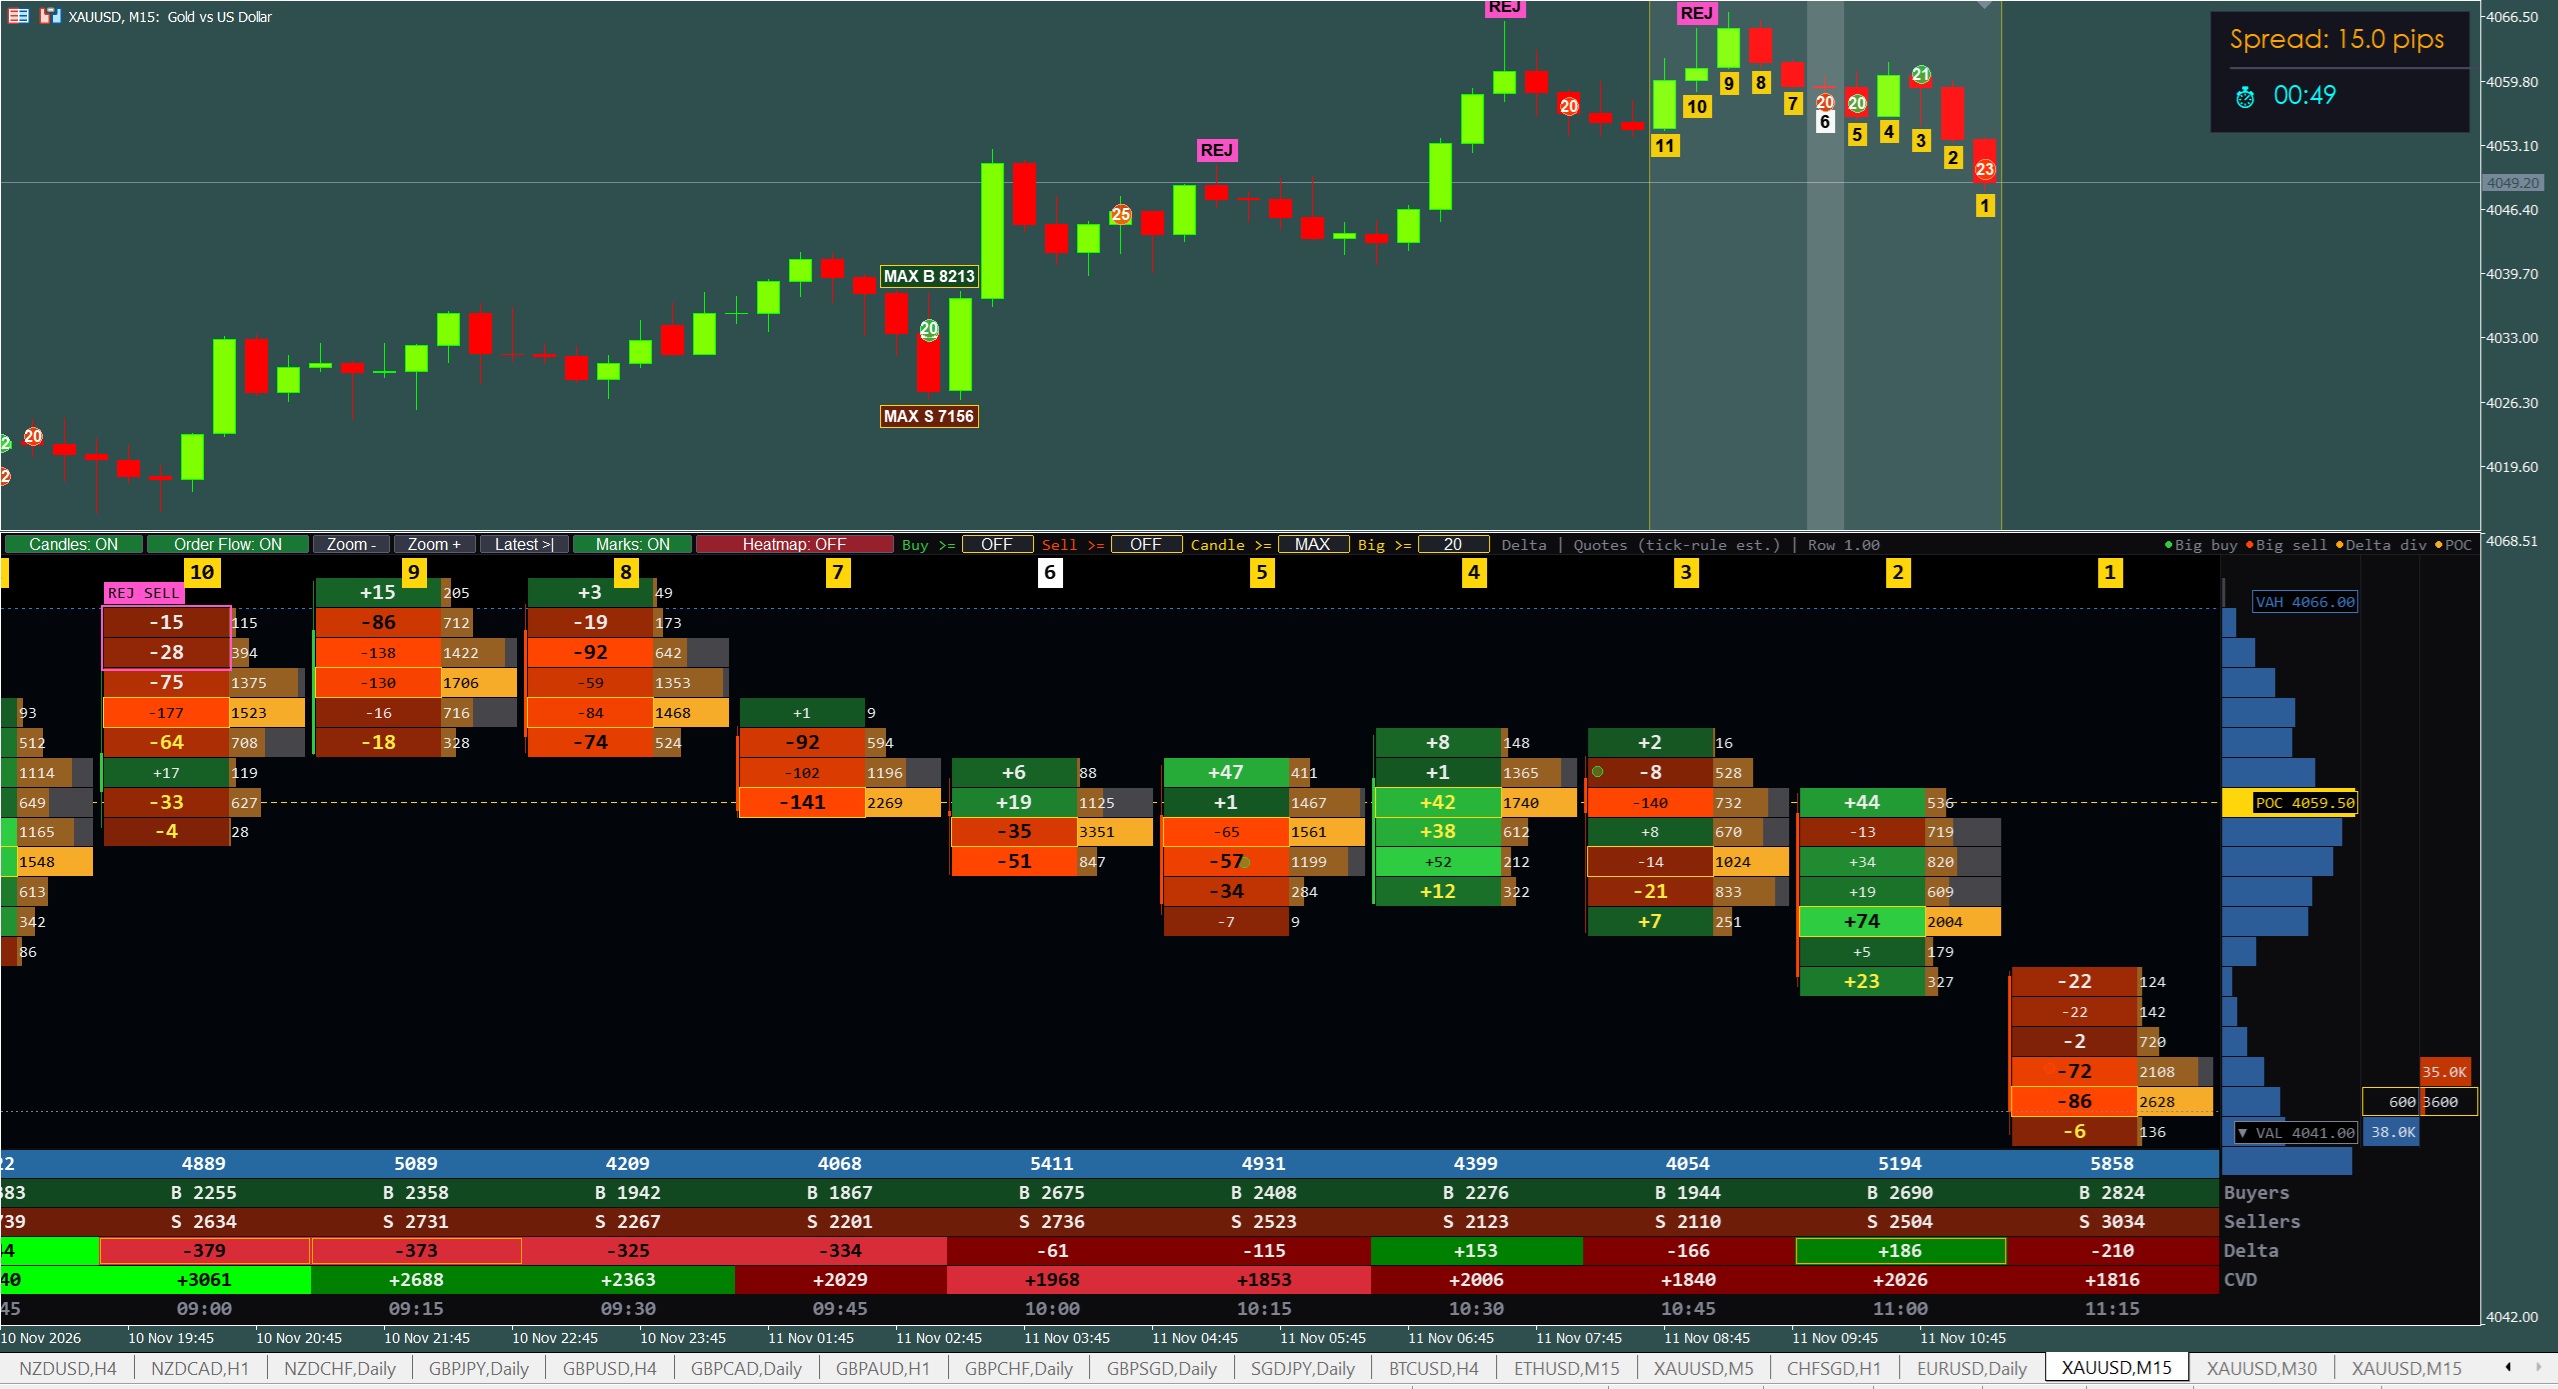
Every candle is opened up level by level: sellers on the left, buyers on the right (e.g. 2812 × 2736), plus a volume histogram and the candle's own POC. You see exactly where buyers and sellers fought — not just where the candle opened and closed. Three display modes: Bid × Ask, Delta and Volume.
Buyers at one price are compared with sellers one level below (and vice versa). When one side is 300% or more of the other, the number is printed big and bold — yellow for buyers, white for sellers. Ratio and minimum volume are fully adjustable.
Three or more imbalances in a row show aggressive, one-sided pressure. The indicator draws a cyan STACK BUY or magenta STACK SELL zone and extends it to the right until price returns — these zones often act as support and resistance on the retest. Found on a fixed grid, so zones never change when you zoom.
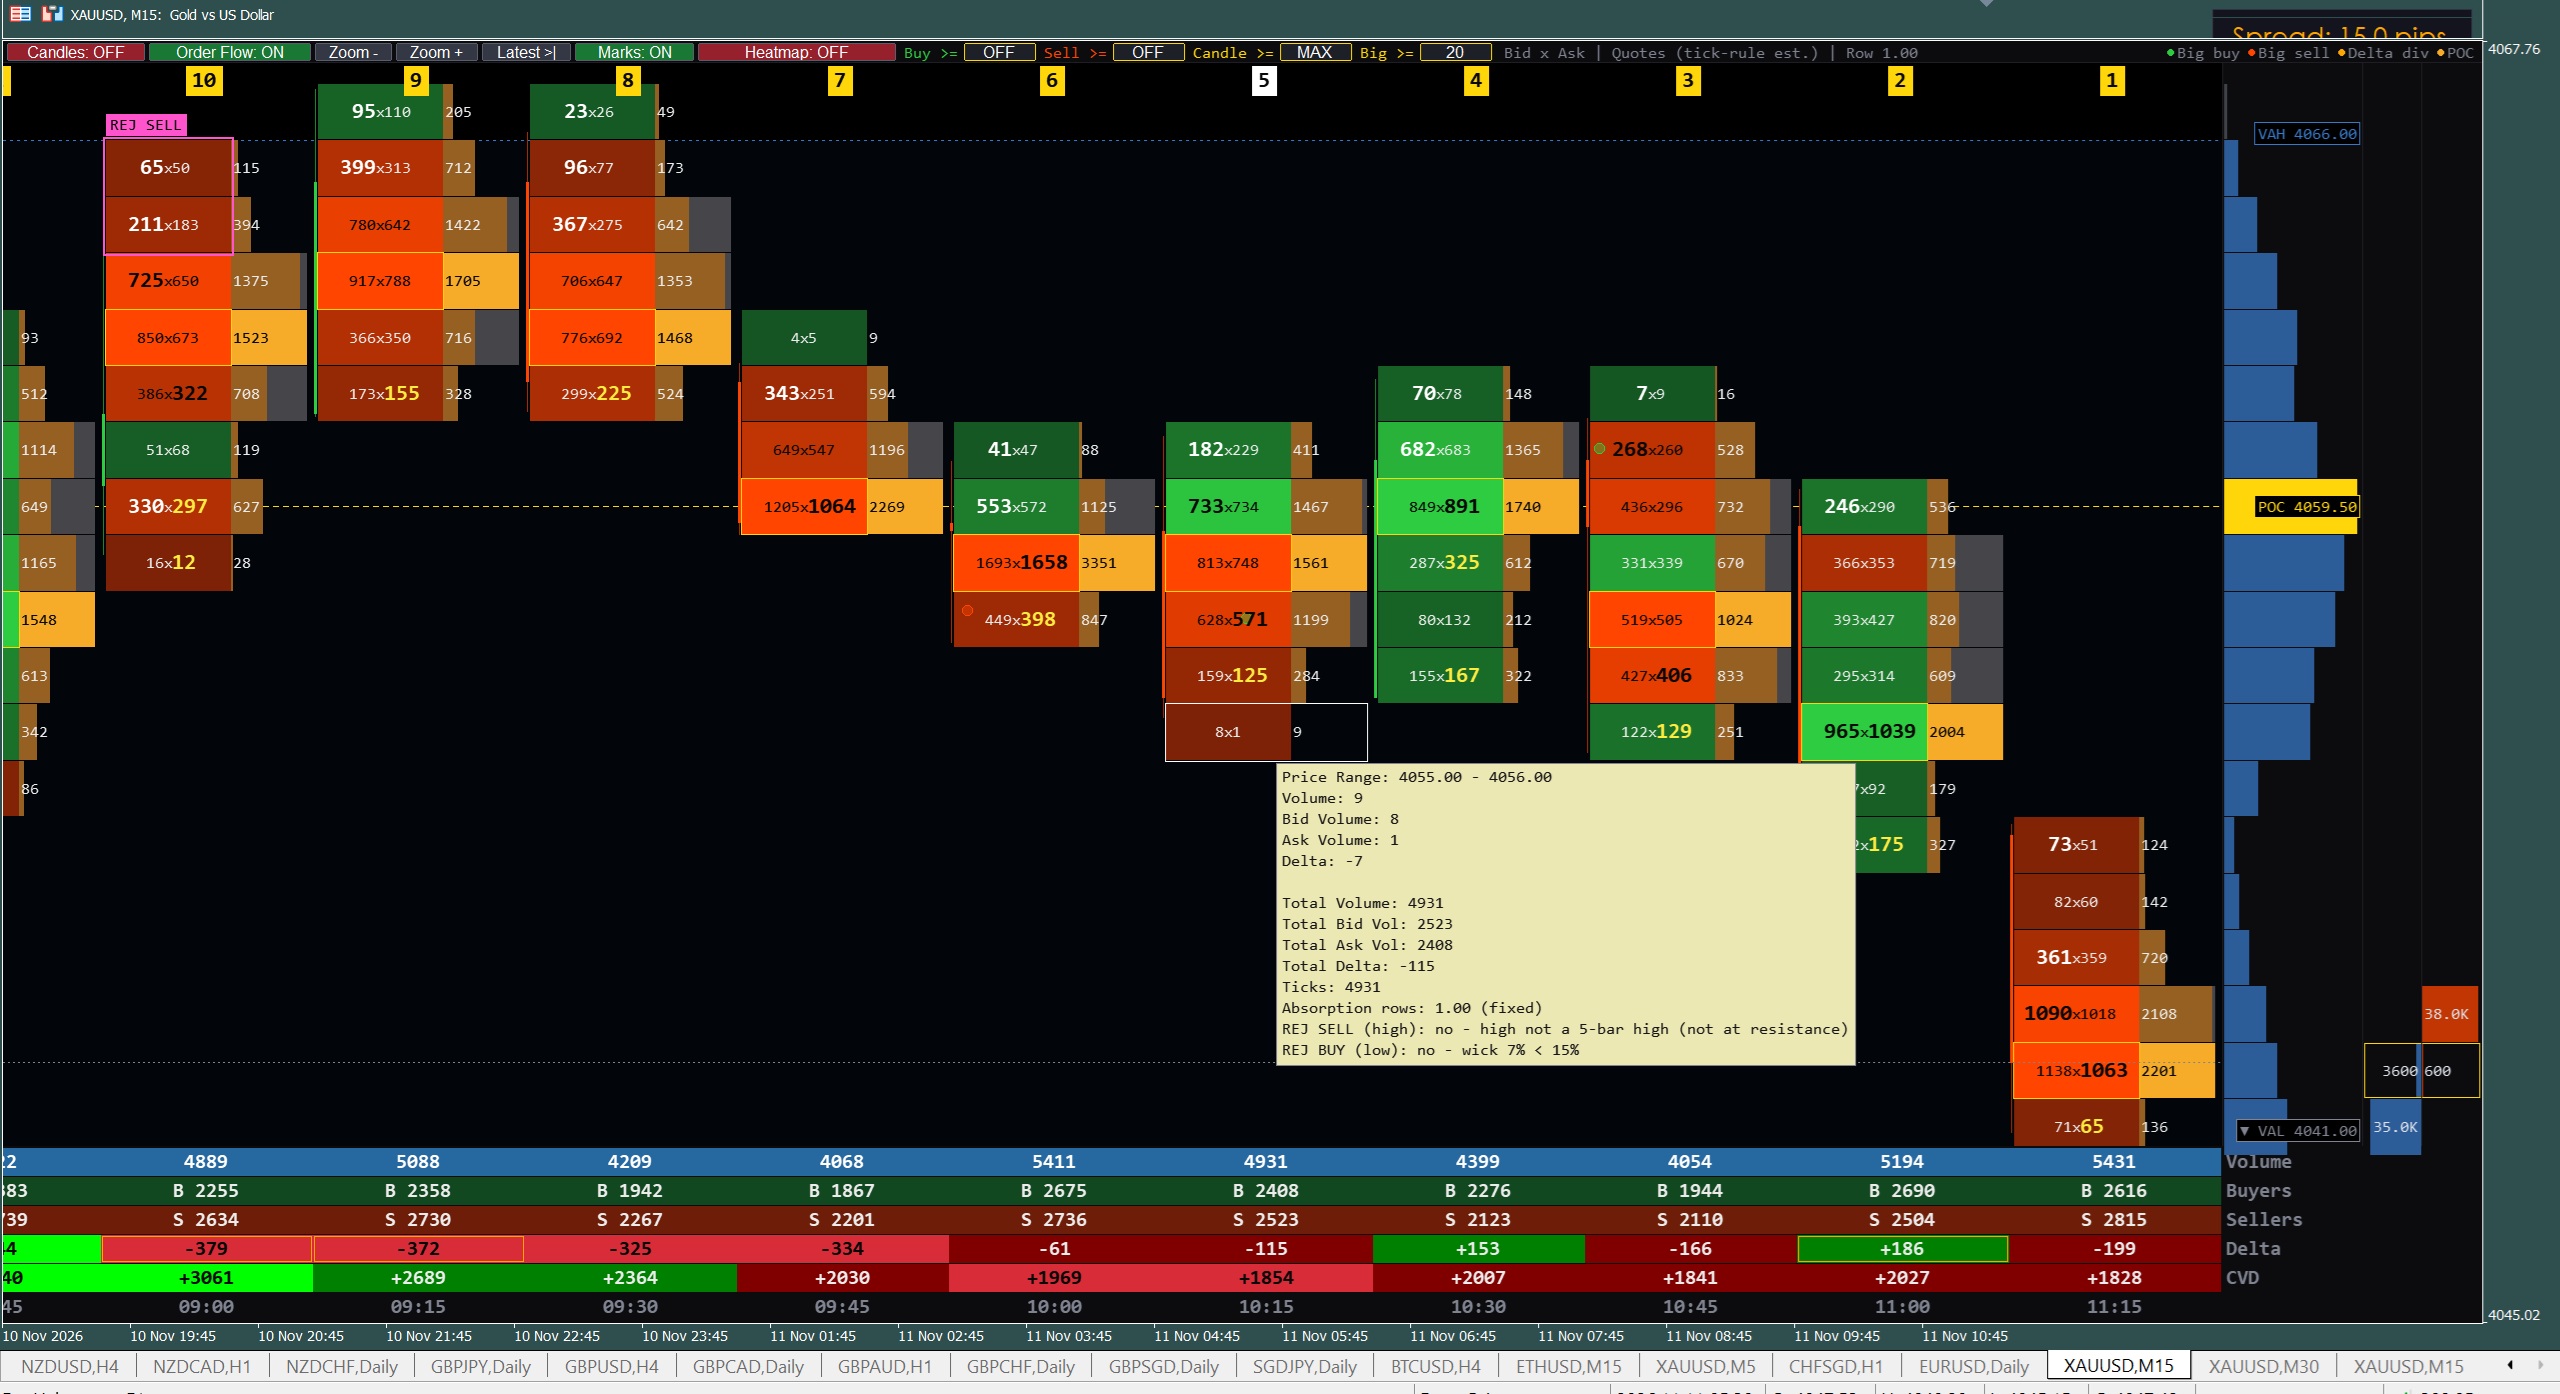
Finds candles where heavy volume hit the high or the low and was rejected. ABS = proven absorption (aggressor dominated the wick, on real exchange trades). REJ = confirmed rejection (location at a swing high/low + the next candle's delta reverses) — built for Forex & CFD data. Closed candles only, so signals do not repaint.
Delta = buyers minus sellers per candle. CVD = the running total. Four colours tell you at a glance whether the move is weak or aggressive: Lime / Green for buying, Red / Maroon for selling. CVD restarts every day, week, month or year depending on the time frame, and its colour shows the momentum of the last few candles.
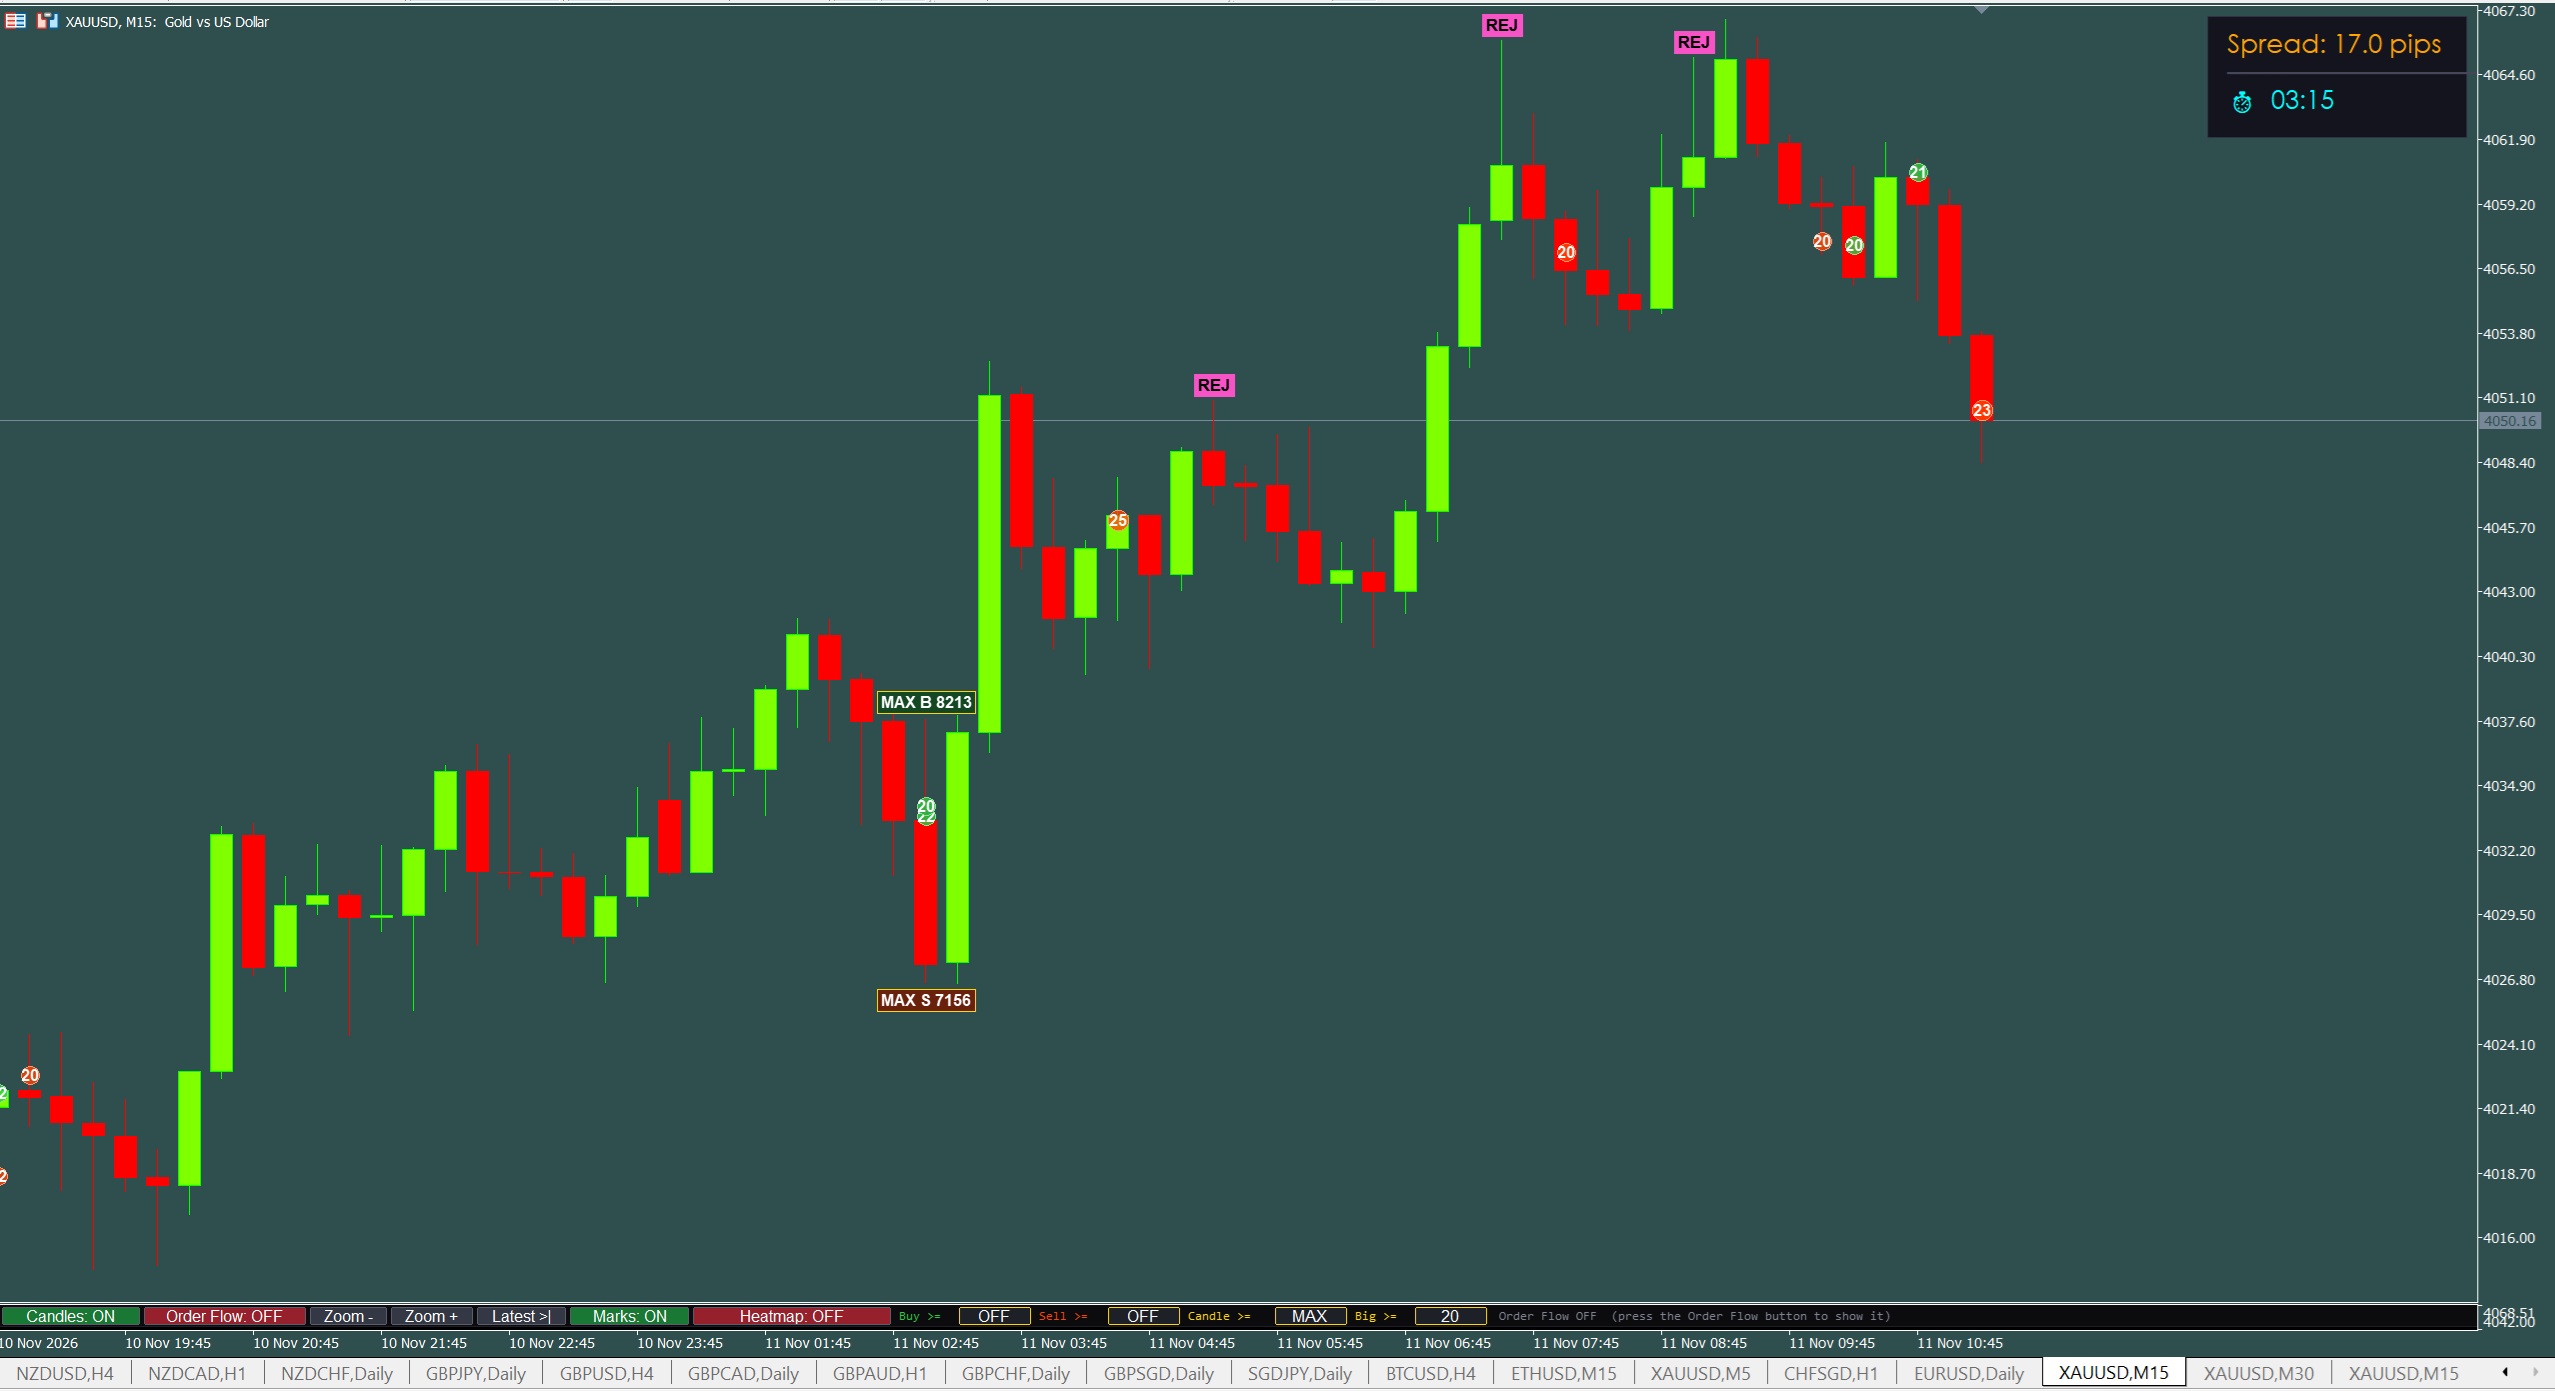
A candle is tagged MAX B or MAX S when its buyers or sellers beat every one of the previous 20 closed candles. Fixed per candle — it never jumps around while you scroll or zoom. Optional "Candle >=" and "Buy >= / Sell >=" filters highlight any volume you choose.
Large aggregated prints are shown as green (buy) and red (sell) bubbles — in the footprint and directly on your price candles — with the size printed inside. Use the live "Big >=" box to show only the trades that matter to you.
A side panel shows the session's volume at each price with POC (busiest price), VAH and VAL (70% value area). Choose Session or Visible-candles mode. When a level is off screen it stays visible at the panel edge with an ▲ / ▼ arrow — you always know where value is.
When your broker provides market depth, the DOM ladder shows waiting buy and sell limit orders, and the Bookmap-style Heatmap shows where large resting orders sat over time. Bright horizontal lines that stay put are real walls. Full view or overlay mode.
◀ Swipe or use the arrows to scroll through the screenshots ▶
| Signal / Element | Where | Chart Colour | What It Means |
|---|---|---|---|
| Bid × Ask cell | Footprint | 🟢 Green / 🟠 Orange-red | Sellers × Buyers at that price; colour = which side won |
| Imbalance | Footprint | 🟡 Big yellow / ⚪ big white number | One side ≥ 300% of the other diagonally — aggressive pressure |
| STACK BUY | Footprint | 🔷 Cyan zone + badge | 3+ buy imbalances in a row — likely support on the retest |
| STACK SELL | Footprint | 🟣 Magenta zone + badge | 3+ sell imbalances in a row — likely resistance on the retest |
| ABS / REJ BUY | Footprint + price chart | 🔵 Cyan badge | Selling into the low was absorbed / rejected — bullish |
| ABS / REJ SELL | Footprint + price chart | 🩷 Pink badge | Buying into the high was absorbed / rejected — bearish |
| MAX B / MAX S | Price chart + bottom strip | 🟨 Yellow-framed tag | Most buyers / sellers of the last 20 closed candles |
| Big Trade | Footprint + price chart | 🟢 / 🔴 Bubble with size | Large print at that price ("Big >=" filter) |
| Delta | Bottom strip | 🟩 Lime · 🟢 Green · 🟥 Maroon · 🔴 Red | Buyers − sellers of the candle, weak or strong (5% rule) |
| CVD | Bottom strip | Same 4 colours | Running total; colour = momentum of the last 5 candles |
| Delta divergence | Bottom strip | 🟨 Yellow frame | Delta points one way, candle closes the other — absorption warning |
| POC / VAH / VAL | Volume Profile panel | 🟡 Yellow · 🔵 Blue dashed | Busiest price and the 70% value area of the session |
| DOM / Heatmap | Right panel / Heatmap view | Bright = large orders | Waiting limit orders (needs broker market depth) |
| Input | Value | Why |
|---|---|---|
| Data source | Auto | Real trades on exchange symbols, quote tick-rule on Forex / CFD |
| Show absorption markers | true | Turns on ABS / REJ signals |
| Absorption mode | Auto | Strict on real trades, Rejection + delta confirm on CFD |
| Signal sensitivity | Balanced | Conservative = fewer & cleaner · Aggressive = more signals |
| Imbalance ratio / Stacked rows | 3.0 / 3 | Classic 300% imbalance, 3 in a row = stacked zone |
| Strong Delta % | 5 | Above 5% of volume = Lime / Red (strong) |
| CVD restarts every | Auto | Day on M1–H1, week on H4, month on D1, year on W1+ |
| Volume profile range | Session | Visible-candles mode keeps POC / VAH / VAL always on screen |
✓ One next Update free ✓ 10AM to 6PM Support
Professional Bid × Ask footprint in its own window under the price chart. Every number is always visible, dark text on bright cells for easy reading, and three modes: Bid × Ask, Delta and Volume.
Each footprint column gets a yellow number and the same number is printed under its price candle. Hover a column and its candle lights up — you never lose track of which candle you are reading.
Zoom from a wide overview (Out 3) to big detailed numbers (In) with one click. Drag the footprint to scroll — the price chart follows, and scrolling the price chart moves the footprint too.
Absorption and Rejection signals are judged on closed candles only, on a fixed analysis grid. Hover any candle to read the exact reason it passed or failed, and the header shows which rule blocks signals most.
Lime, Green, Maroon and Red instantly separate strong from weak buying and selling — perfect for beginners. Delta divergences are framed in yellow so absorption warnings jump out.
Cyan STACK BUY and magenta STACK SELL zones extend right until price revisits them, with dashed edges that never cover the numbers of other candles.
Type a value in "Buy >=", "Sell >=", "Candle >=" or "Big >=" right on the chart — matching levels are highlighted and labelled on the price candles instantly, no need to open the inputs.
Automatically detects real exchange trades or Forex / CFD quotes. On CFDs buyers and sellers are estimated with the tick rule — the header always tells you which data you are looking at.
Your purchase includes one free update to the next version, with new features, improved signal logic and performance enhancements at no additional cost.
Start with the Session Volume Profile: is price at the POC, above the VAH or below the VAL? Mark nearby STACK zones — that is where the big fight is likely to happen.
When price reaches your level, watch the footprint and the Delta / CVD colours. An ABS / REJ signal, a Delta divergence or a strong Lime / Red Delta tells you which side is winning.
Enter in the direction of the confirmed side, place your stop beyond the absorbed high / low, and use the next STACK zone or value-area edge as your target.
It works on MetaTrader 5 (MT5) only, on every symbol your broker offers — Gold (XAUUSD), Forex pairs, Indices, Crypto and exchange futures — and on every time frame from M1 to Monthly.
On exchange symbols (futures, stocks) the indicator reads real trades with their buy / sell flags. Forex and CFD brokers do not publish real trades, so the indicator estimates buyers and sellers from every price tick (tick rule) — the same method other MT5 footprint tools use. The header always shows "REAL trades" or "Quotes (tick-rule est.)", and the signals were tuned for both cases.
ABS (Absorption) is shown when real trade data proves that aggressive buyers or sellers dominated the wick and still got rejected. REJ (Rejection) is used on Forex / CFD data: a heavy candle rejects a swing high or low and the next candle's Delta confirms the reversal. Choose Conservative, Balanced or Aggressive sensitivity to control how many signals you see.
No. ABS / REJ, MAX B / MAX S and stacked zones are calculated on closed candles with fixed analysis rows, so they do not change when you scroll, zoom, refresh or switch time frames. Only the live candle's footprint keeps updating while it is forming.
The DOM ladder and the Heatmap need Level-2 market depth from your broker. Many Forex / CFD brokers send no depth or only a few quotes near the price. Everything else — footprint, Delta, CVD, imbalances, ABS / REJ, MAX tags and Volume Profile — works without it.
No. The colour system (Lime / Green / Maroon / Red), the ABS / REJ badges and the STACK zones are made to be read at a glance, and support will guide you through reading the footprint. We recommend practicing on a demo account for 3–5 days before trading live capital.
One next update is included free of charge. You will be notified via WhatsApp when a new version is available.
Yes, support is available 10AM to 6PM IST via WhatsApp and live chat. We will guide you through installation, setup, and how to read every element of the Order Flow window.
1) After payment of this Indicator, I want your Real MT5 Account no with proper screenshot.
2) I want your working mail id for sending you indicators.
3) Indicators will be locked on the shared MT5 account number. So only you can use it. Be sure while sharing your MT5 account number. It should and must be correct.
4) After purchasing this indicator trade on demo accounts for 3 to 5 days in order to understand thoroughly how it works then switch on a REAL account.
5) After purchasing this indicator, It can't be transferred to another MT4/MT5 account or Return or any Exchange with other indicators.
6) If Anyone is purchasing any 2 sets of Version 4 or version 5 or version 6 Indicators for Ex: (Binary Indicator and Forex Indicator) or (Forex and Digital) or (Binary & SnR Indicator) or (Snr & Forex Indicator)..... at the same time. Then i will give the remaining other's indicator free of cost. Its not like you purchased 1 indicator today and the other one after few days. Then it will not be applicable.
7) On each referral i will pay you 50$ who ever will purchase any v4 or v5 or v6 or v7 indicator through you. For more details WhatsApp me.
IMPORTANT NOTICE: Trading in financial markets, including digital options, forex, stocks, and cryptocurrencies, involves substantial risk and may not be suitable for all investors. The high degree of leverage can work against you as well as for you. Before deciding to trade, you should carefully consider your investment objectives, level of experience, and risk appetite.
There is a possibility that you may sustain a loss of some or all of your initial investment. You should not invest money that you cannot afford to lose. Past performance is not necessarily indicative of future results. The indicators and tools provided by TrendingMoiz are for educational and informational purposes only and should not be considered as financial advice.
We strongly recommend that you seek advice from an independent financial advisor and ensure you fully understand the risks involved before trading. No representation is being made that any account will or is likely to achieve profits or losses similar to those discussed in any material on this website.
Performance Disclaimer: The accuracy rates and results mentioned are based on historical backtesting and may not reflect actual trading results. Individual results may vary based on market conditions, trading discipline, and proper risk management.